Monitoring and Tracing
In addition to the core components, Istio installation includes a collection of optional monitoring and tracing services, these tools are:
-
Prometheus: for collecting and querying monitoring and metrics data.
-
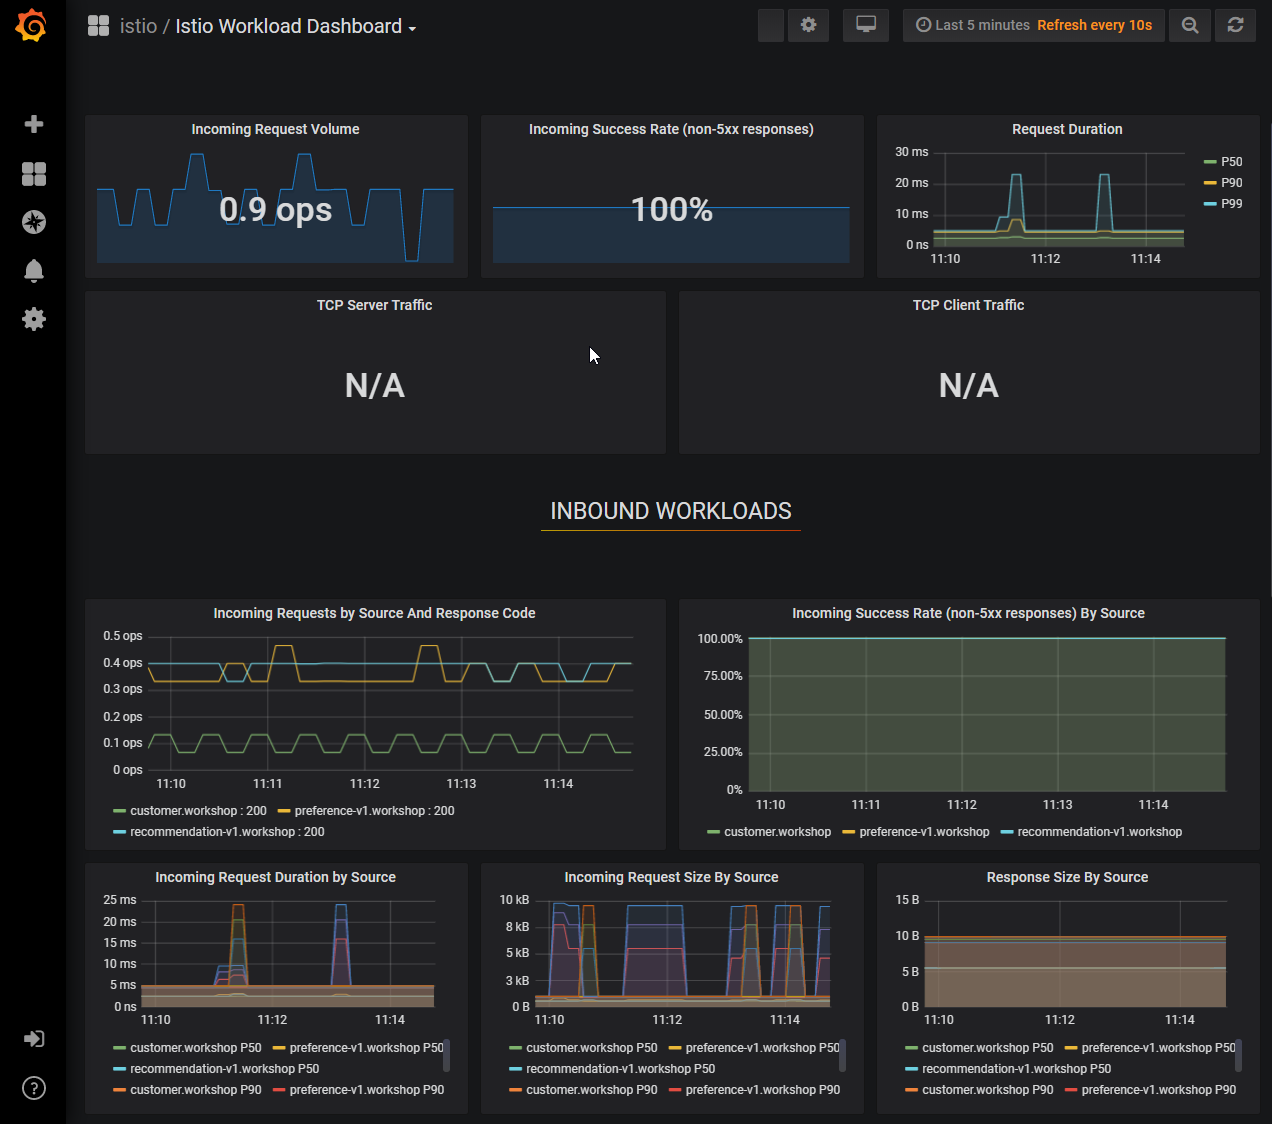
Grafana: for visualizing monitoring and metrics data from Prometheus.
-
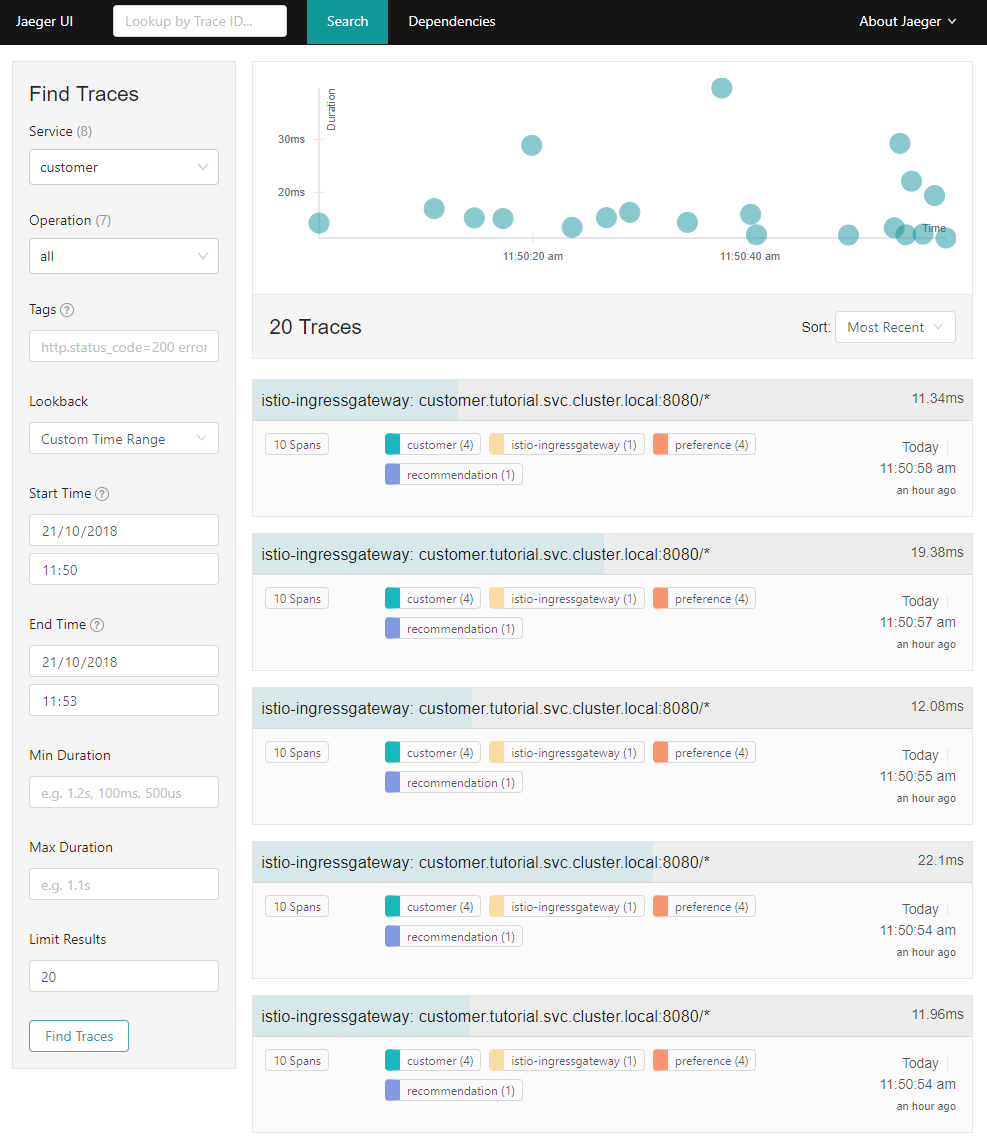
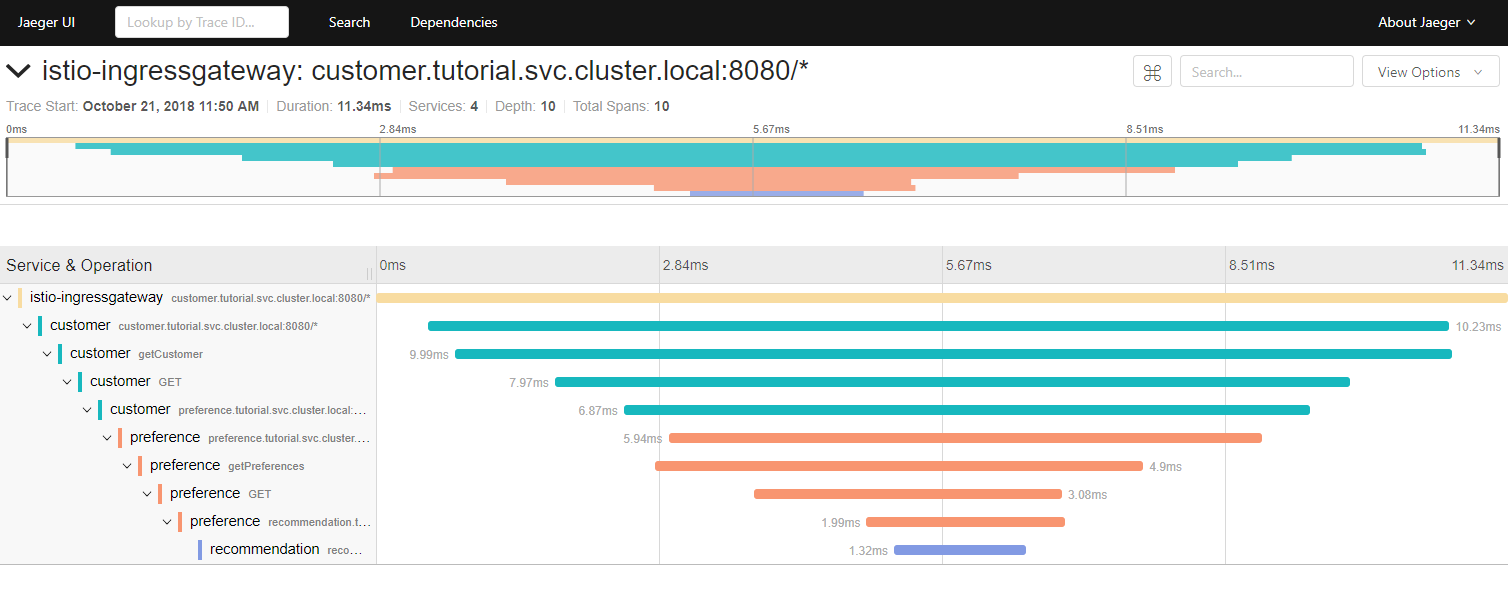
Jaeger: for distributed tracing to track every request through mesh allowing a deeper understanding about request latency, serialization and parallelism.
-
Kiali: for visualizing different aspects of your mesh, this includes viewing service graph and traffic flow and your Istio configuration files.
Examine the Istio running services and notice the presence of the following services : prometheus,grafana, jaeger-query and kiali.
$ kubectl get services -n istio-system

NAME                     TYPE           CLUSTER-IP      EXTERNAL-IP    PORT(S)                                                                                                                                      AGE
grafana                  ClusterIP      10.19.245.231   <none>         3000/TCP                                                                                                                                     4h11m
jaeger-query             ClusterIP      10.19.248.252   <none>         16686/TCP                                                                                                                                    4h11m
kiali                    ClusterIP      10.19.250.198   <none>         20001/TCP                                                                                                                                    4h11m
prometheus               ClusterIP      10.19.240.238   <none>         9090/TCP                                                                                                                                     4h11m
...
Making dashboards publicly available
For the sake of simplicity we will expose publicly the four dashboards to avoid you using a complicated kubectl port-forward command. The dashboards are exposed in the same way as we exposed the customer service with the help of a Gateway and a VirtualService.
$ kubectl apply -f src/install/1.2.5/dashboardsLoad generation
Before looking at metrics, it is helpful to generate a load on the application. For this lab, we will generate a load for 5 minutes using the istio/fortio image.
docker run istio/fortio load -t 5m -qps 5 $customerVizualizing Metrics with Grafana
The Grafana’s address is: http://$GATEWAY_IP:15031/
To display the Istio dashboard, replace the path of the URL by /dashboard/db/istio-workload-dashboard. The URL should look like:
http://$GATEWAY_IP:15031/dashboard/db/istio-workload-dashboardExamine the dashboard, you should see some statistics for the requests you sent earlier.
Querying Metrics from Prometheus
The URL for Prometheus is: http://$GATEWAY_IP:15030/
The Prometheus console should look like this.
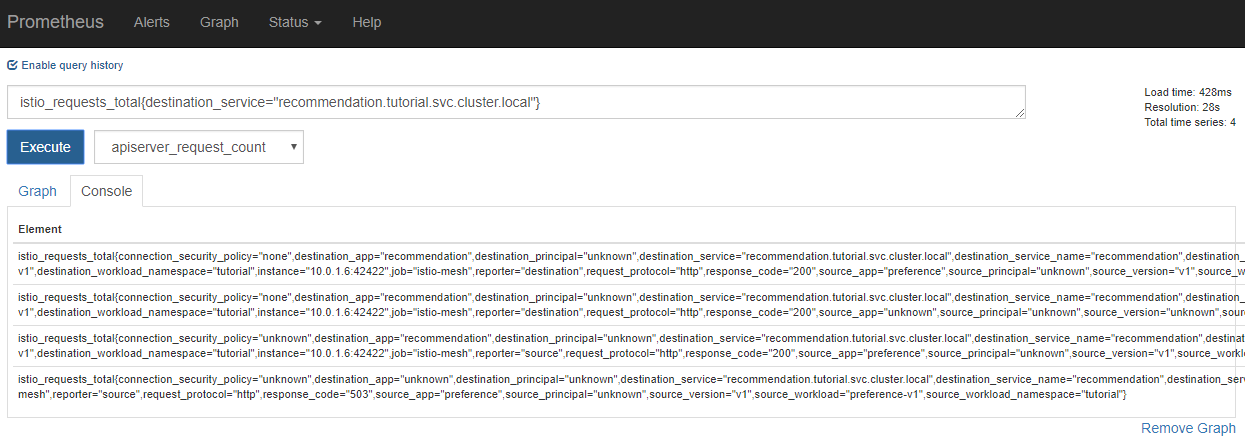
Let’s enter a query to display the total requests sent to the recommendation service:
Enter:
istio_requests_total{destination_service="recommendation.workshop.svc.cluster.local"}select Execute and click on the Graph tab to display the graph corresponding to the load generation query.
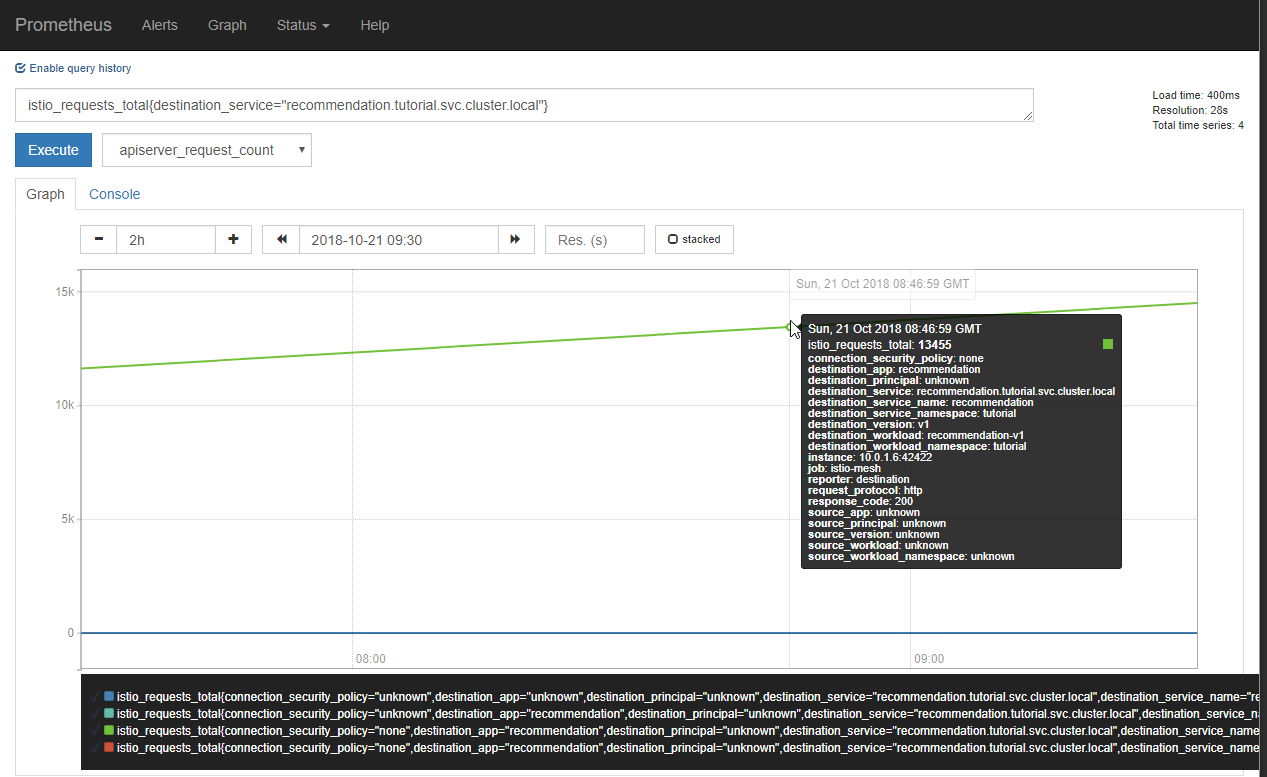
| You may have to refresh the browser for the Prometheus graph to update. |