Observing microservice meshes with Kiali
At some point when you are developing your microservice architecture, you will need to visualize what is happening in your service mesh. You will have questions like “Which service is connected to which other service?” and “How much traffic goes to each microservice?” But because of the loosely tied nature of microservice architectures , these questions can be difficult to answer.
Those are the kinds of question that Kiali has the ability to answer, by giving you a big picture of the mesh, and showing the whole flow of your requests and data.
How does Kiali work?
Kiali taps into the data provided by Istio to generate its visualizations. It fetches ingress data (such as request tracing with Jaeger), the listing and data of the services, health indexes, and so on.
Update Kiali Configuration
To get full featured Kiali (with embeded Jaeger and Grafana), we need to update its configuration.
Update Kiali with the following commands:
export GATEWAY_IP=$(kubectl -n istio-system get service istio-ingressgateway \
  -o jsonpath='{.status.loadBalancer.ingress[0].ip}')

kubectl apply -f - << EOF
apiVersion: v1
kind: ConfigMap
metadata:
  name: kiali
  namespace: istio-system
  labels:
    app: kiali
    chart: kiali
    heritage: Tiller
    release: istio
data:
  config.yaml: |
    istio_namespace: istio-system
    auth:
      strategy: "login"
    server:
      port: 20001
      web_root: /kiali
    external_services:
      tracing:
        url: http://$GATEWAY_IP:15032/jaeger
      grafana:
        url: http://$GATEWAY_IP:15031
      prometheus:
        url: http://$GATEWAY_IP:15030
EOF

kubectl delete pod -l app=kiali -n istio-system
Generating Sample Data
To show the capabilities of Kiali, you’ll need an Istio-enabled application to
be running. For this, we can use the customer-tutorial application we created
earlier.
To generate data for it, we can fortio it with this command:
docker run istio/fortio load -t 5m -qps 5 $customerKiali’s URL is: http://$GATEWAY_IP:15029
The default credentials are "admin/admin", but it’s recommended to change them before using it in production.
Service Graph
After you login, you should see the Service Graph. Before to go further, make sure that you selected the workshop namespace by clicking on Select a namespace menu.
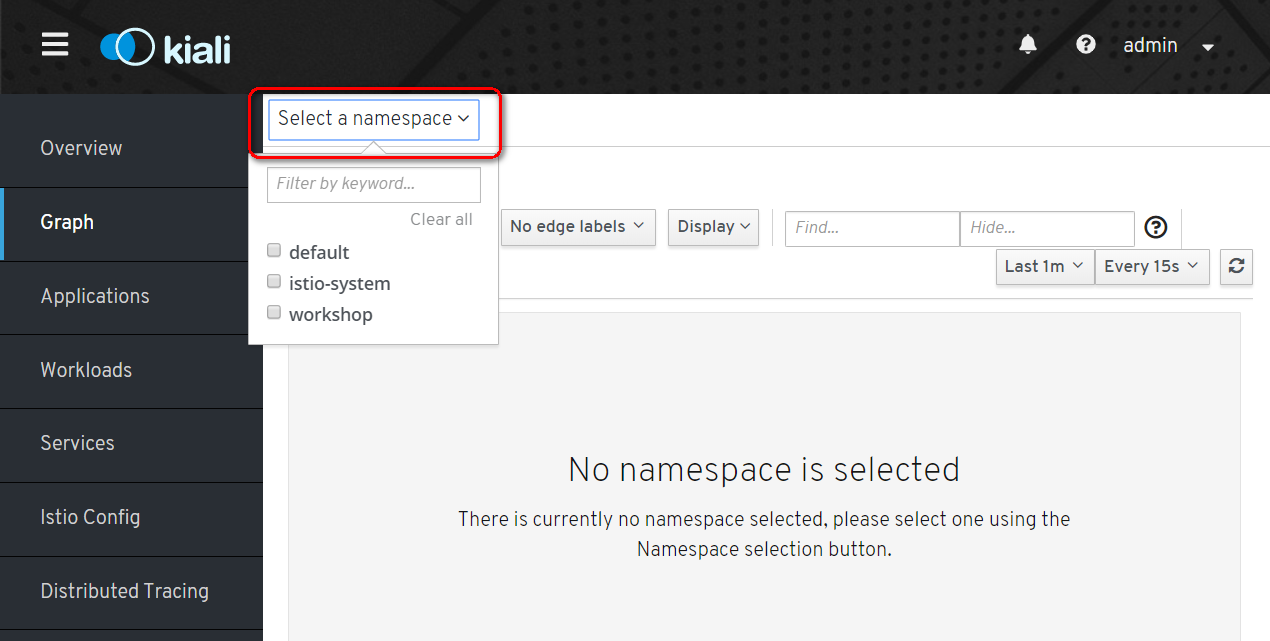
And there you go on the Service Graph page.
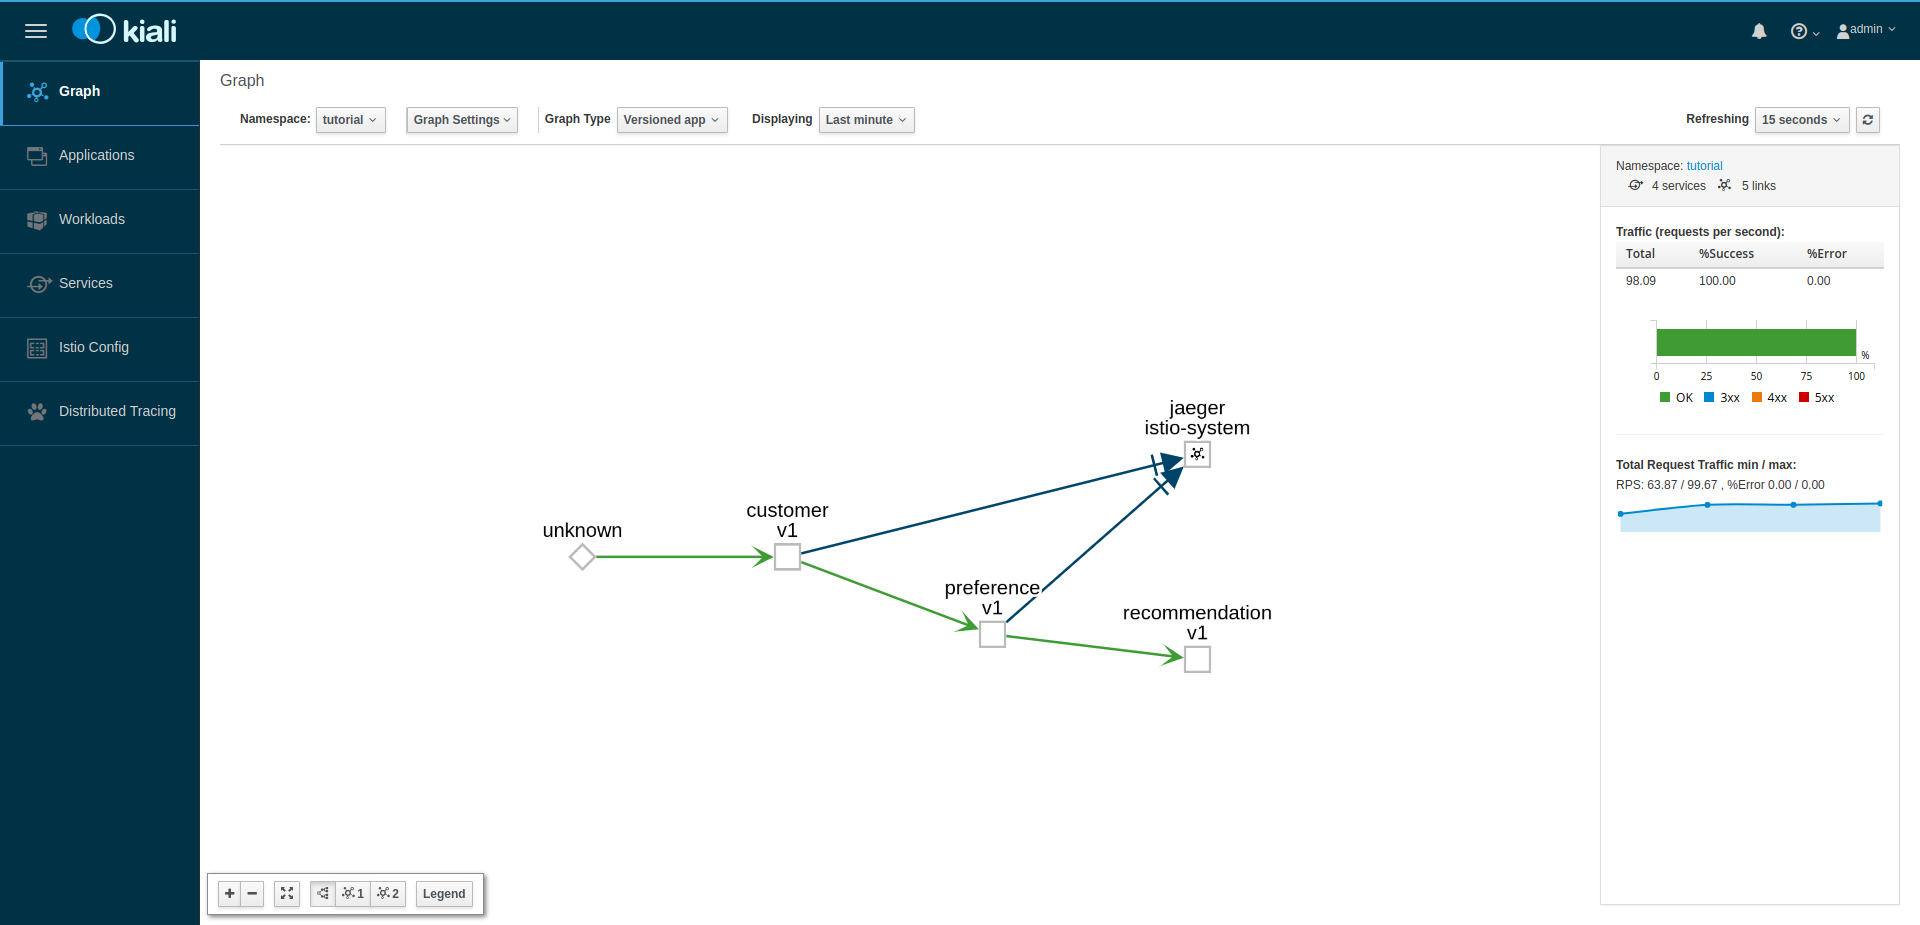
It shows a graph with all the microservices, connected by the requests going through then. On this page, you can see how the services interact with each other.
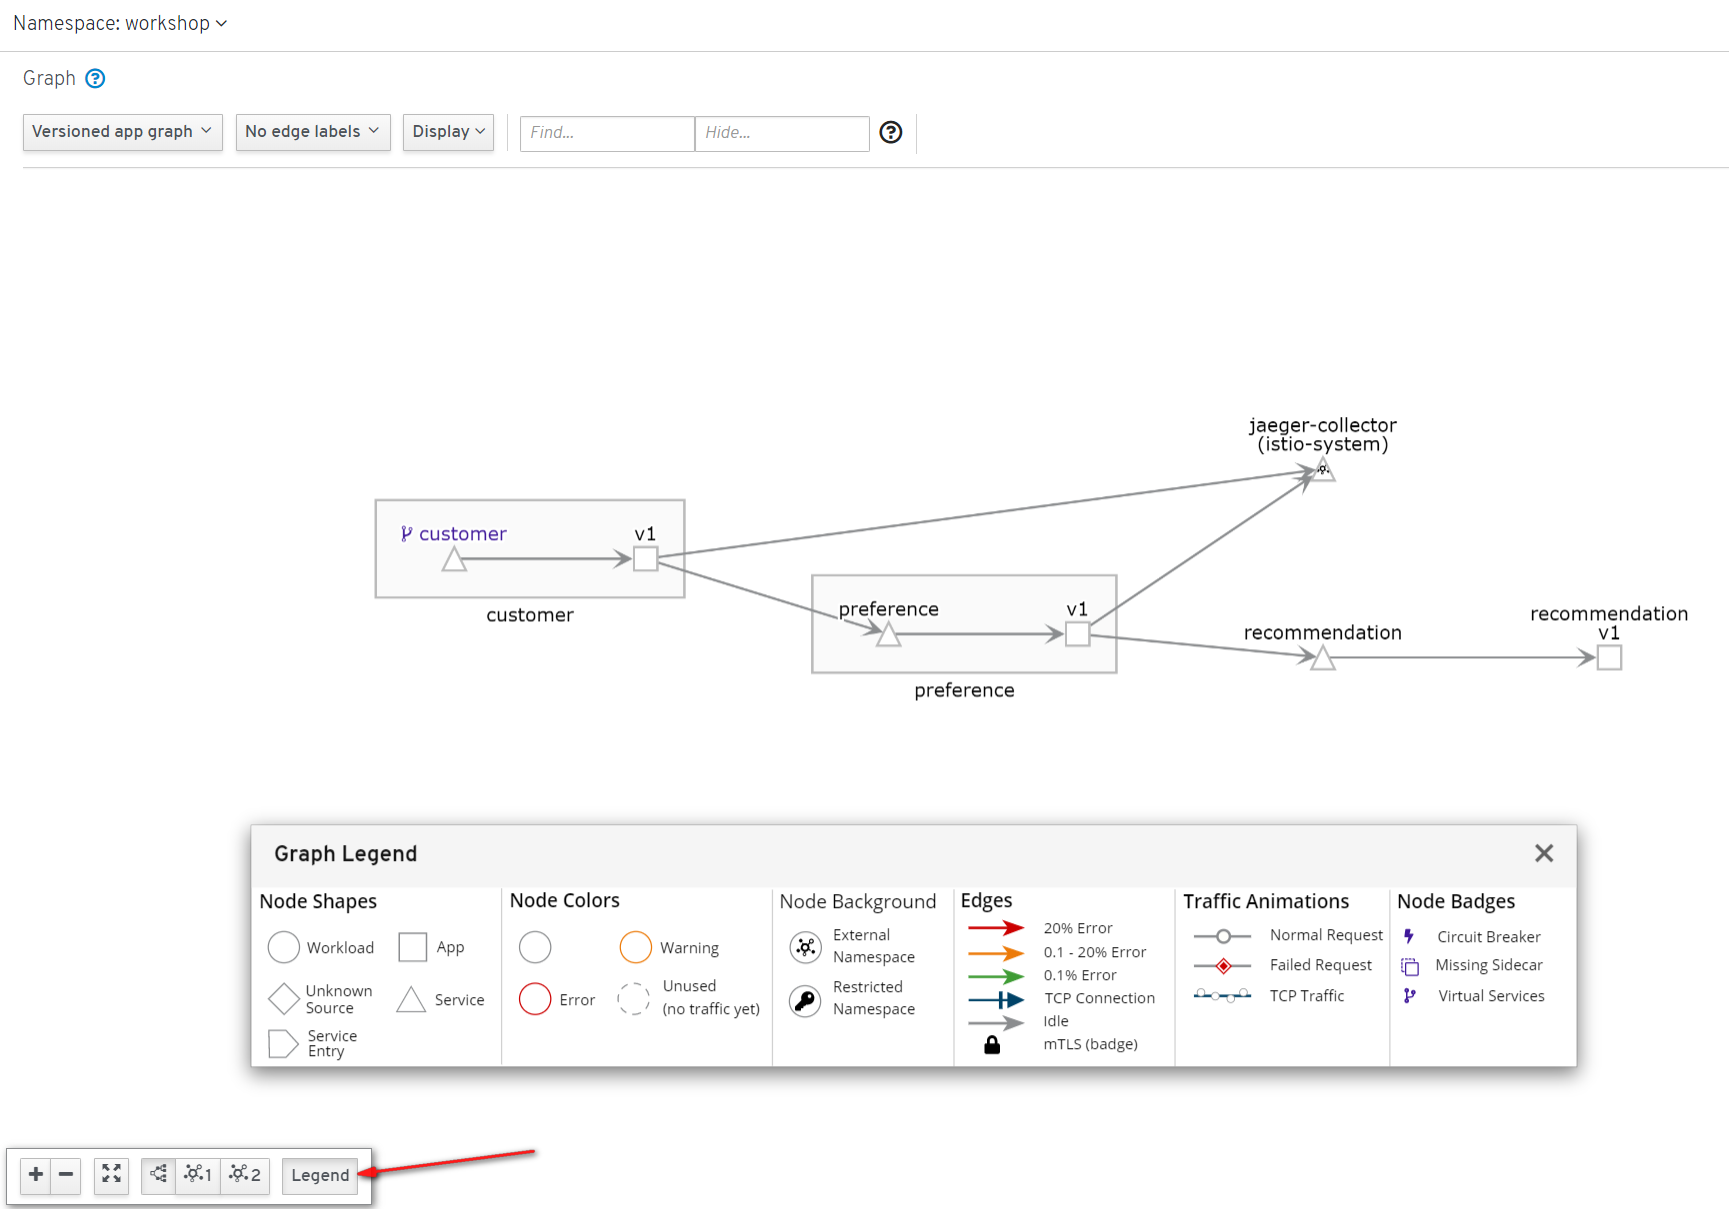
To understand the meaning of every shape and color click on lengend button the show the legend palette.
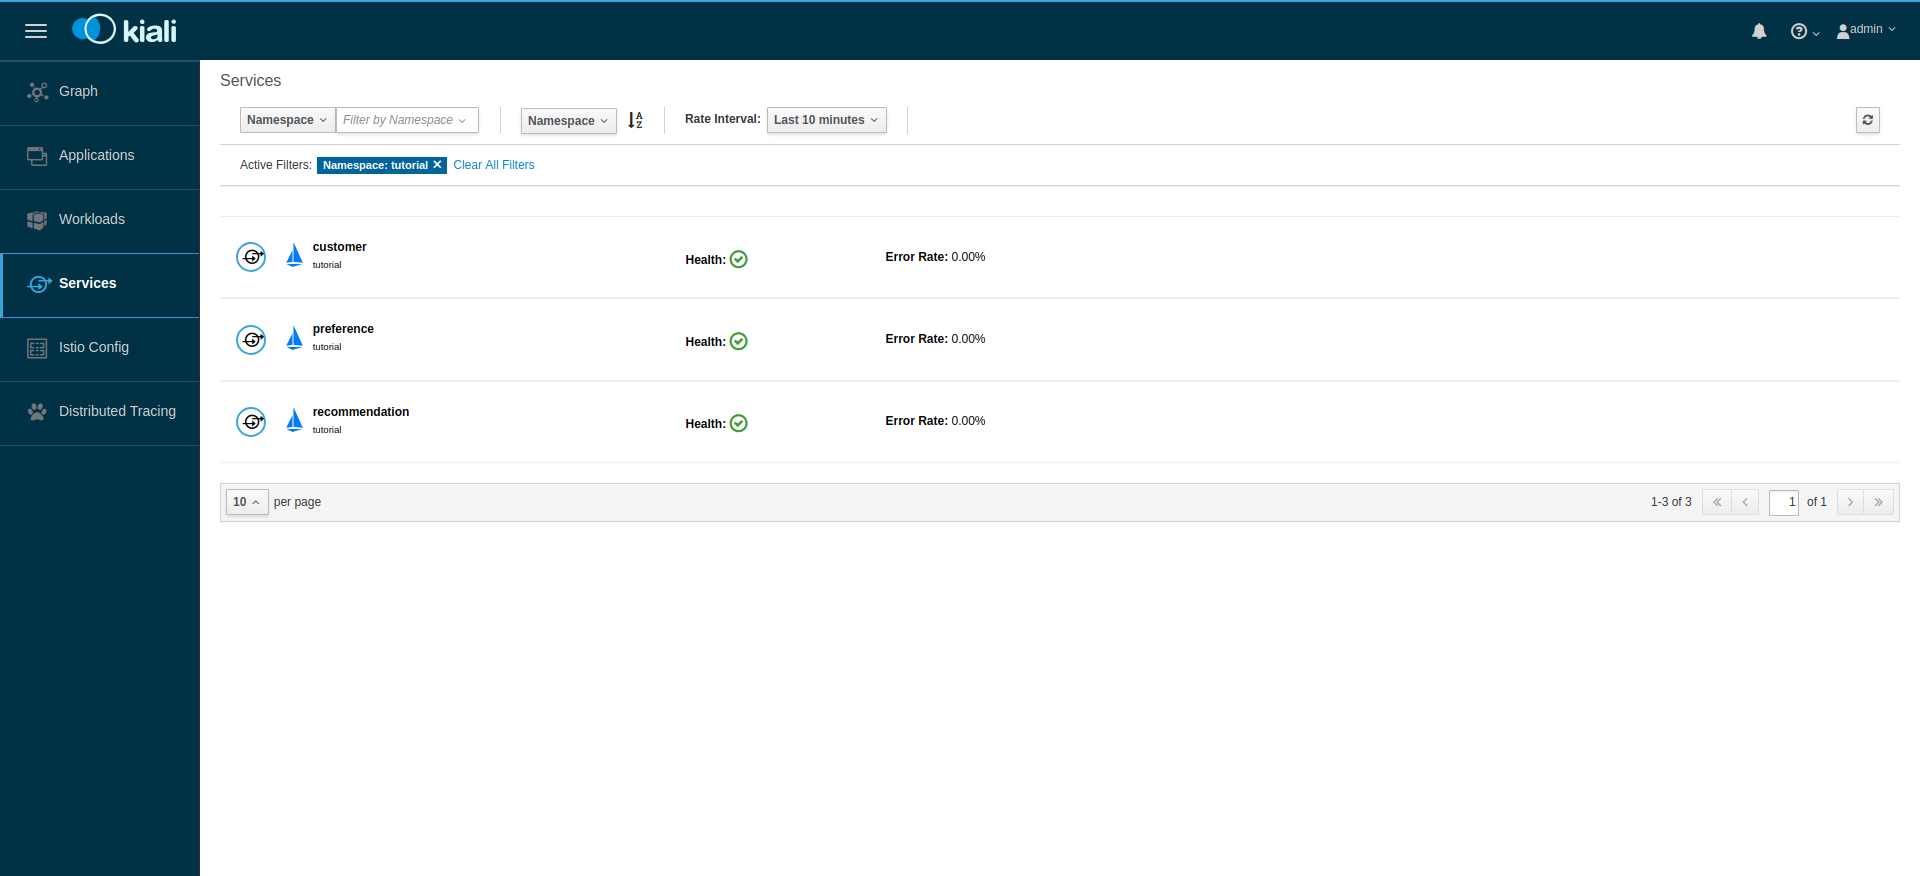
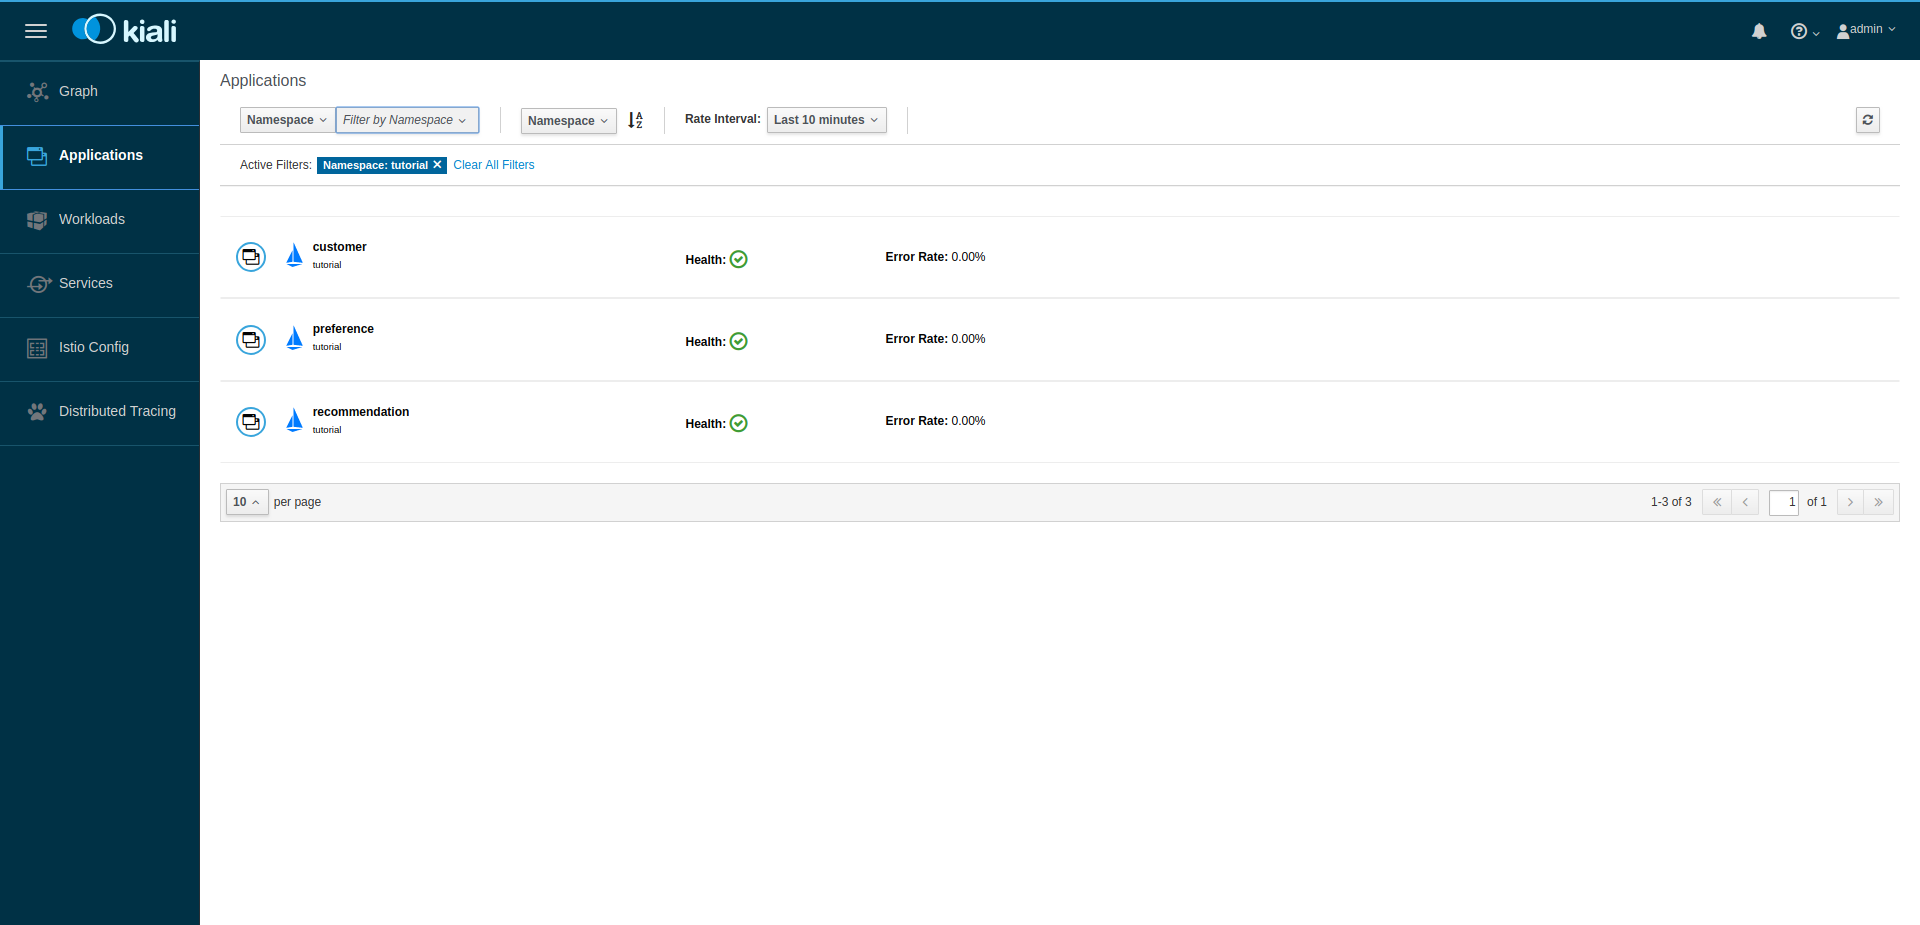
Applications
Click the Applications link in the left navigation. On this page you can
view a listing of all the services that are running in the cluster, and
additional information about them, such as health status.
Click on the "customer" application to see its details:
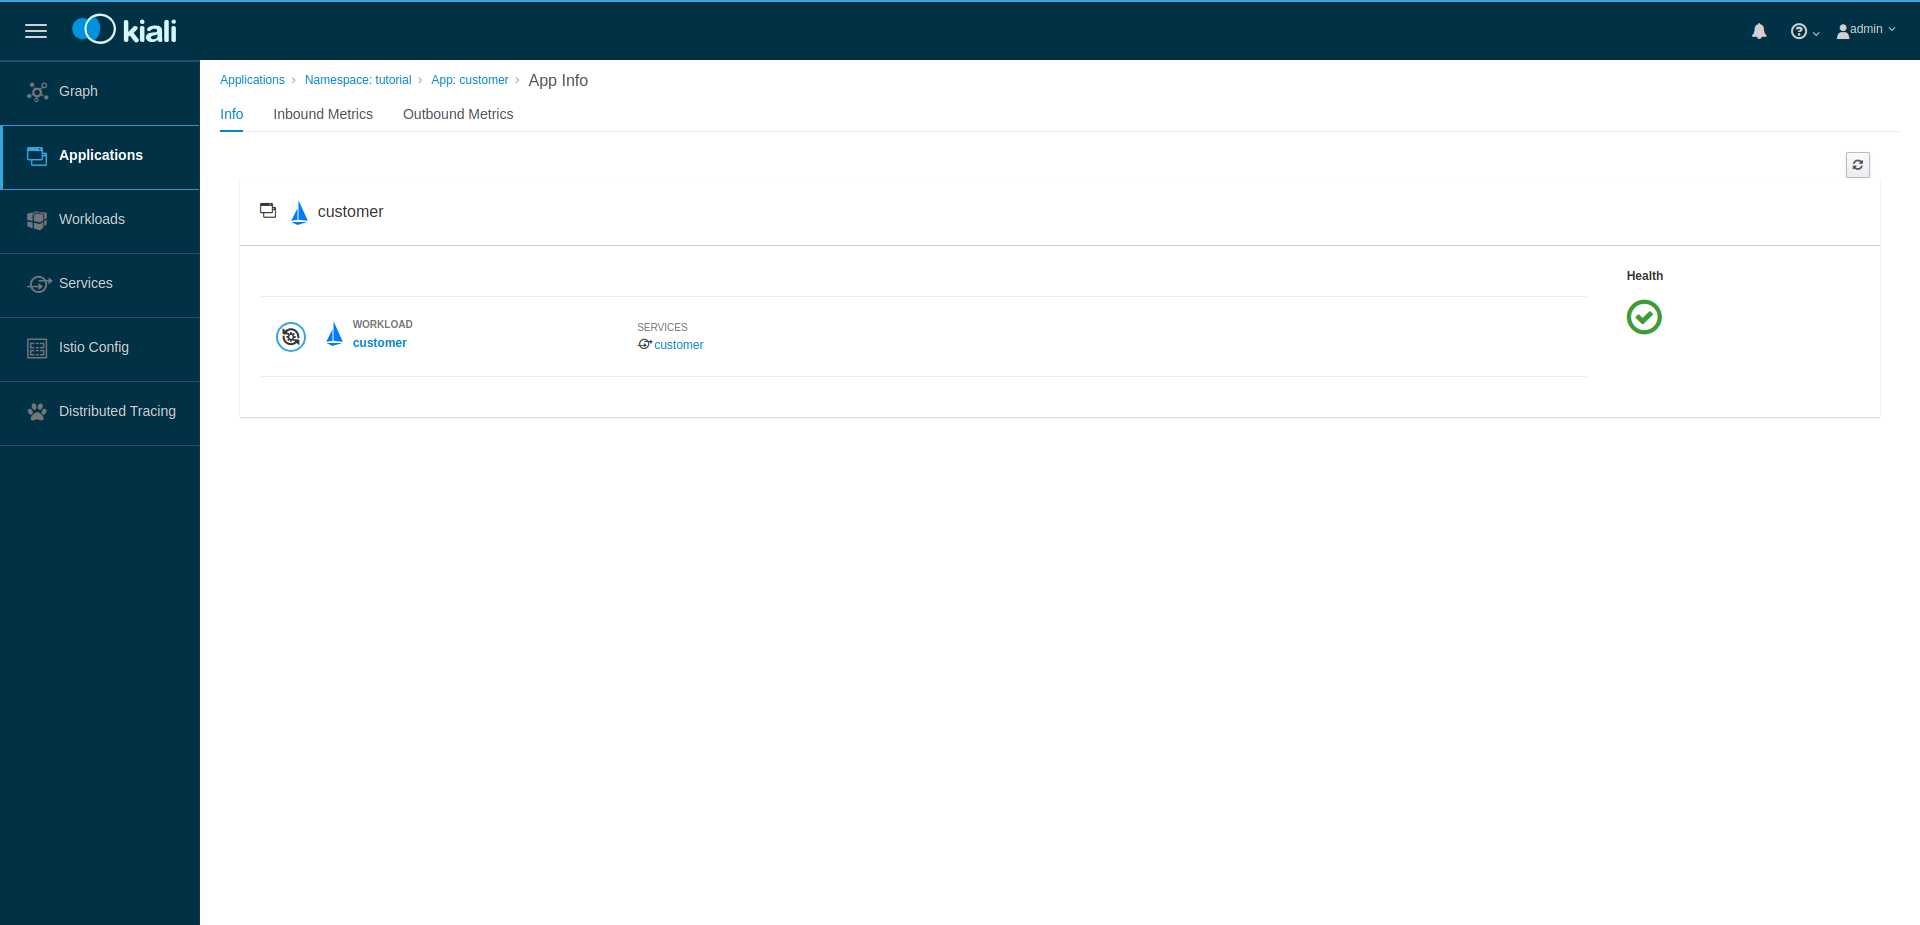
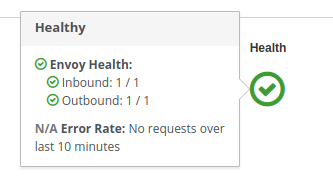
By hovering the icon on the Health section, you can see the health of a service (a service is considered healthy) when it’s online and responding to requests without errors:
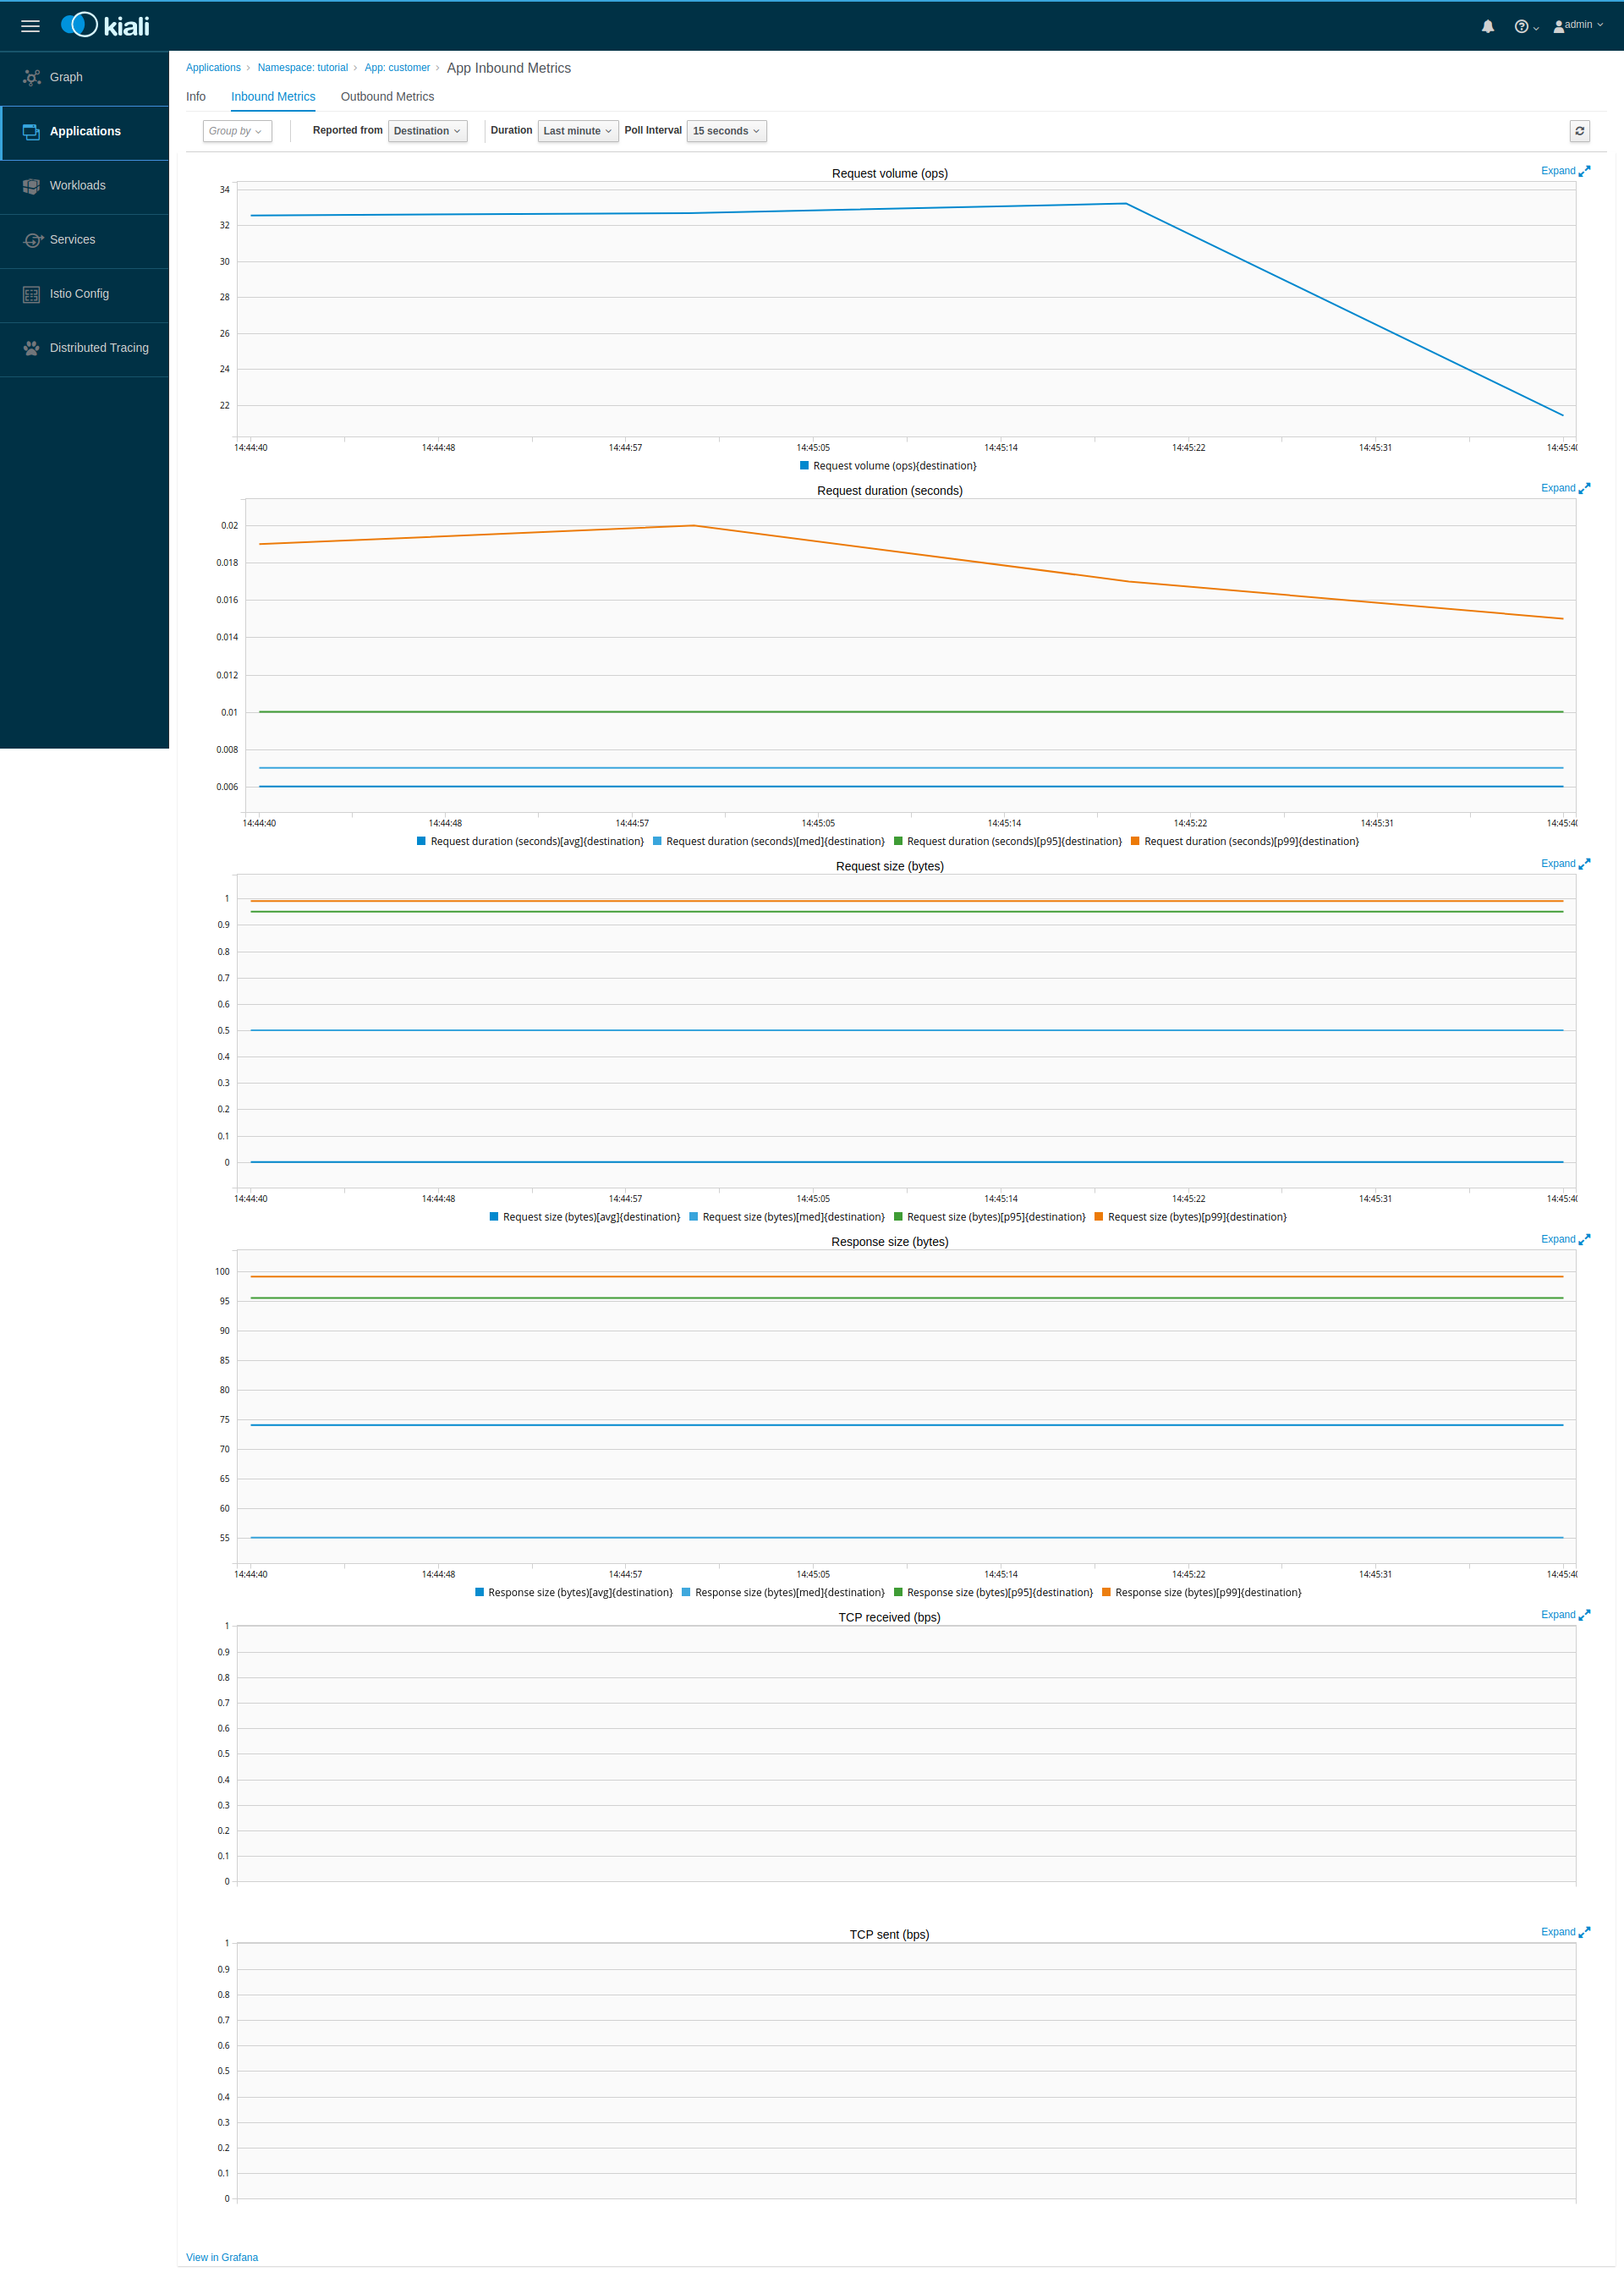
By clicking on Outbound Metrics or Inbound Metrics, you can also see the
metrics for an application, like so:
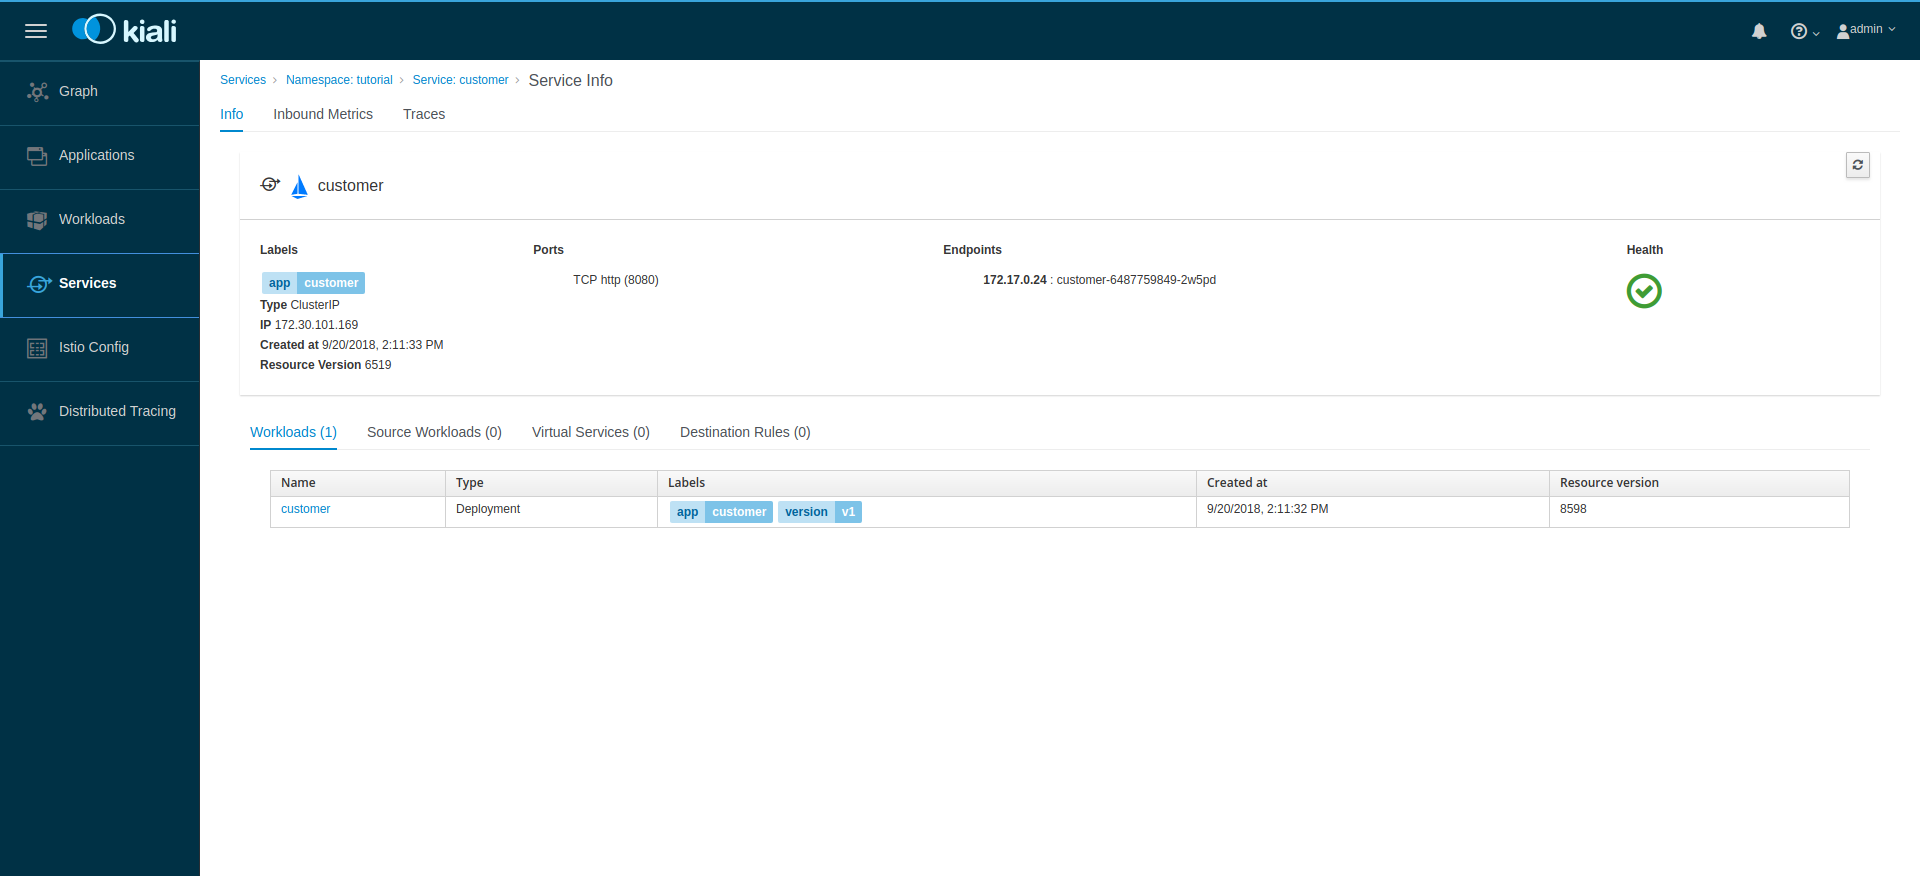
Workloads
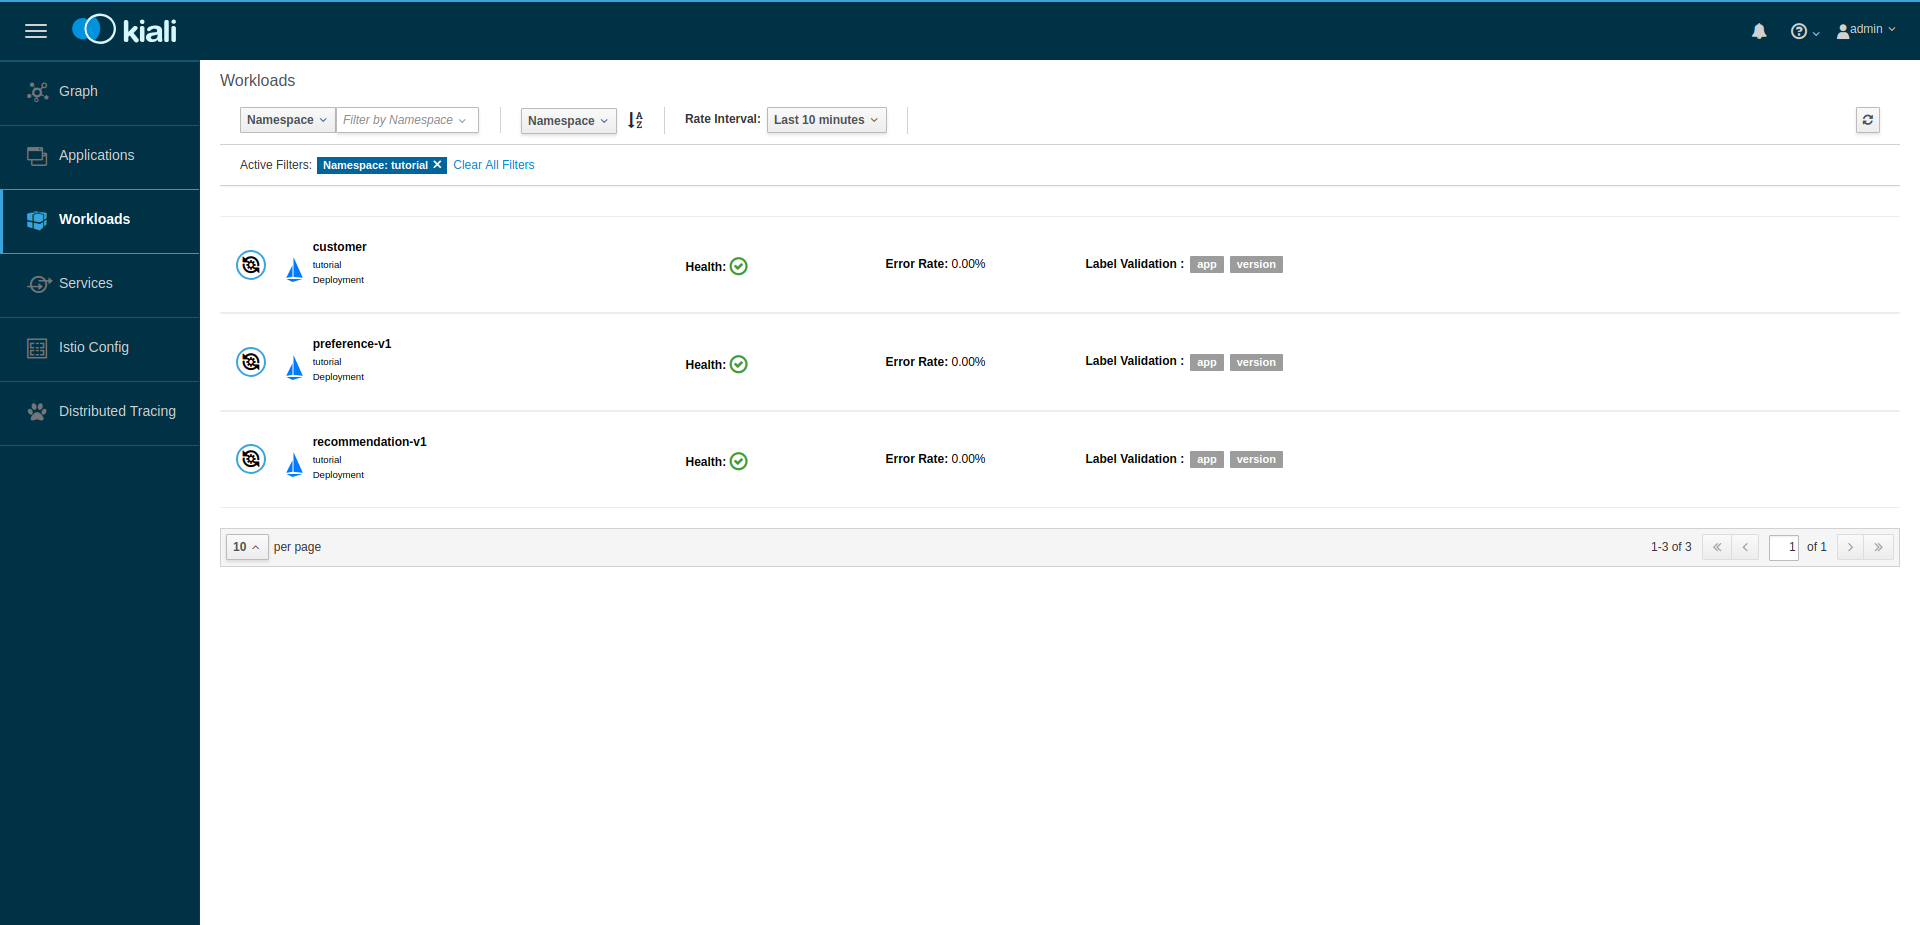
Click the Workloads link in the left navigation. On this page you can view
a listing of all the workloads are present on your applications.
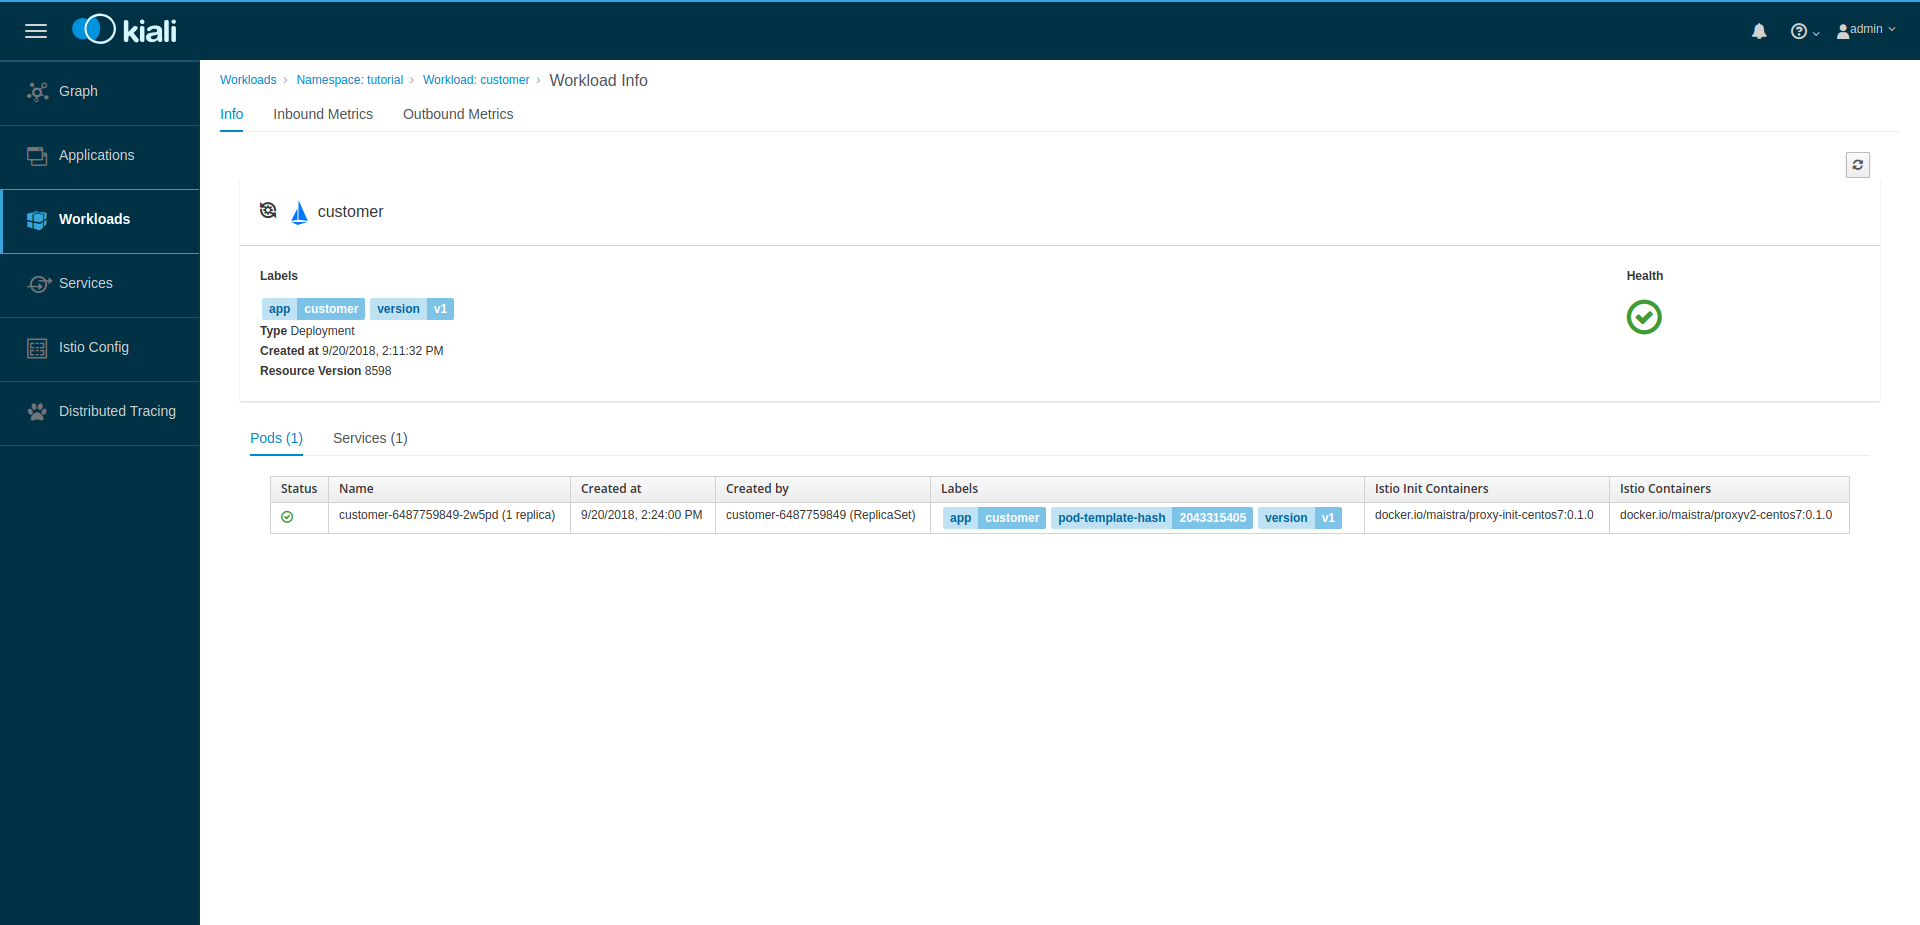
Click on the customer workload. Here you can see details for the workload,
such as the pods and services that are included in it:
By clicking Outbound Metrics and Inbound Metrics, you can check the
metrics for the workload. The metrics are the same as the Application ones.